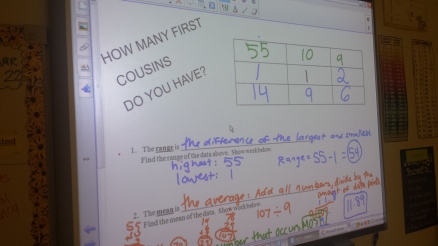
We collected more data today so that we would have random numbers to explore mean, median, mode, and range — the measures of central tendency.
I chose a random sampling of students from the class to give us this data. They each had to tell how many first cousins they have.
I gave them time to think and then randomly selected 9 students. Luckily, in two of the 3 classes we had an obvious OUTLIER (a new term, for some), but it was just what I was hoping for. While most students had anywhere from 4 to 15 cousins, two students in separate classes had 55 and 53 cousins, respectively. WOW!
 This gave us something to work with! We reviewed mean, median, range, and mode and found each of these for the set of data.
We then discussed the outlier and what it does to these measures of central tendency. Students worked in small groups to compare the mean, median, and mode with the outlier to the mean, median, and mode without the outlier.
In the end, they discovered the median number is least affected by the outlier. We had a rushed ending to class so we will discuss this some more tomorrow!
